
Mixed Graphs
Mixed Graphs: Overview
This topic covers concepts, such as, Mixed Graphs, Mixed Graphs of Line and Pie Charts, Mixed Graphs of Bar and Web Charts & Mixed Graphs of Web and Table Charts etc.
Important Questions on Mixed Graphs
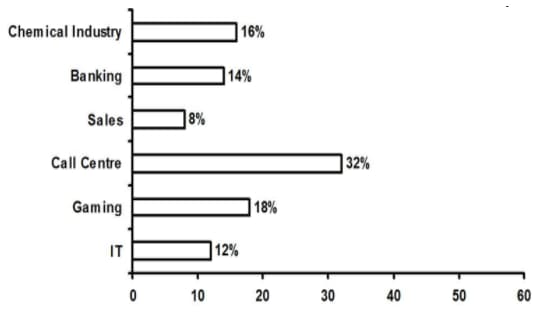
Read the following graph and table carefully and answer the question given below.
Total number of employees
Percent of employees working in the night shift from different industries in a city:
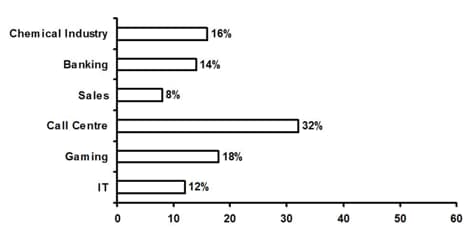
| Industries | Percent of Women |
| IT | |
| Gaming | |
| Call Centre | |
| Sales | |
| Banking | |
| Chemical Industry |
What is the difference between the number of working males in Call Centre and Sales industries?
Read the following pie-chart and table carefully and answer the question given below.
Total number of passenger
Percentage of passengers travelling in different trains:
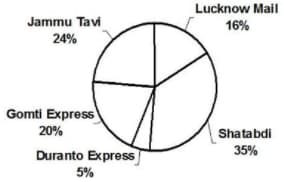
| Train | Number of male passengers |
| Shatabdi | |
| Duranto Express | |
| Gomti Express | |
| Jammu Tavi Express | |
| Lucknow Mail |
The total number of females in all the trains is approximately what percent of the total number of passengers?
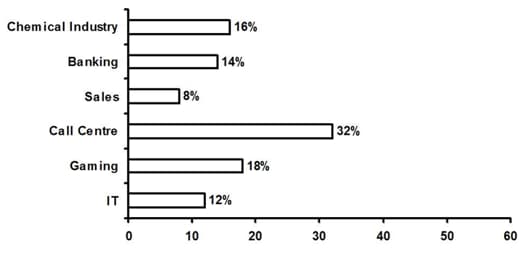
Read the following graph and table carefully and answer the question given below.
Total number of employees
Percent of employees working in the night shift from different industries in a city:
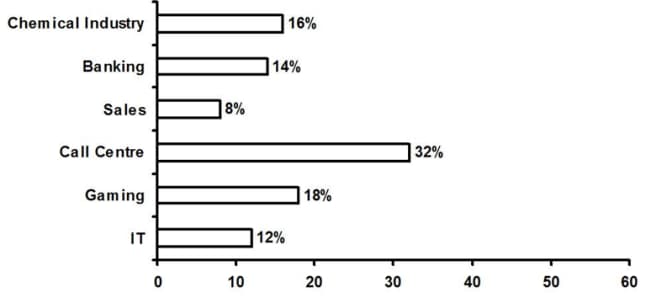
| Industries | Percent of Women |
| IT | |
| Gaming | |
| Call Centre | |
| Sales | |
| Banking | |
| Chemical Industry |
In which two industries the number of working women are equal?
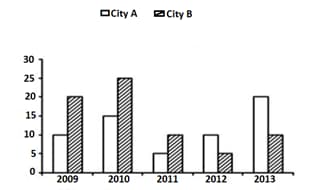
Read the following graph and table carefully and answer the question given below.
Percentage increase in the population of two cities in different years:
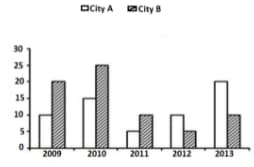
| Population of both city in | |
| City | Population (In Lakh) |
| A | |
| B | |
What is the difference between the population of city A and city B at the end of the year ?
Read the following graph and table carefully and answer the question given below.
Total number of employees
Percent of employees working in the night shift from different industries in a city:
| Industries | Percent of Women |
| IT | |
| Gaming | |
| Call Centre | |
| Sales | |
| Banking | |
| Chemical Industry |
What is the average number of working males in Banking and Chemical industries?
Read the following graph and table carefully and answer the questions given below.
The ratio of females and males in institutes
| Institute Year↓ |
A |
B |
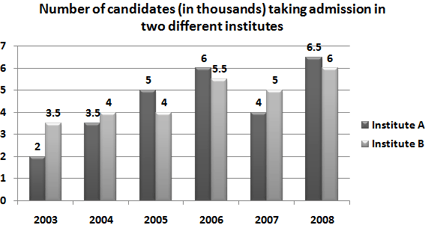
What is the average number of males in institute B in all the years?
Read the following graph and table carefully and answer the question given below.
Total number of employees
Percent of employees working in the night shift from different industries in a city:
| Industries | Percent of Women |
| IT | |
| Gaming | |
| Call Centre | |
| Sales | |
| Banking | |
| Chemical Industry |
The number of working females in Gaming is approximately what percent more than the number of working females in IT?
Read the following graph and table carefully and answer the question given below.
Total number of employees
Percent of employees working in the night shift from different industries in a city: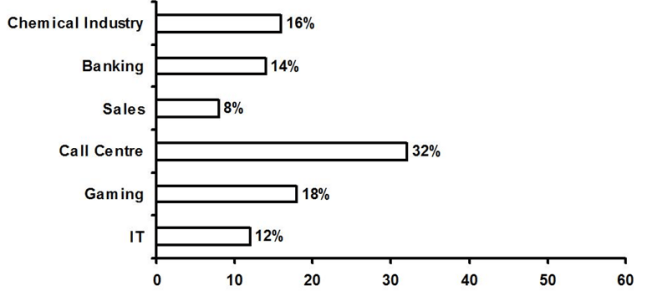
| Industries | Percent of Women |
| IT | |
| Gaming | |
| Call Centre | |
| Sales | |
| Banking | |
| Chemical Industry |
What is the respective ratio between the number of males working in Sales and Chemical industries?
Read the following graph and table carefully and answer the question given below.
Percentage increase in the population of two cities in different years:
| Population of both city in | |
| City | Population (In Lakh) |
| A | |
| B | |
What is the ratio of the population of city A to that of city B at the end of ?
Study the following graph and table carefully and answer the question given below.
Number of readers (in thousands) of two magazines in different cities in
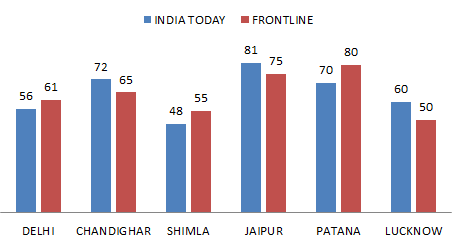
| CITIES | INCREASE IN NUMBER OF READERS IN INDIA TODAY (2012 TO 2013) | INCREASE IN NUMBER OF READERS IN FRONTLINE (2012 TO 2013) |
| DELHI | ||
| CHANDIGHAR | ||
| SHIMLA | ||
| JAIPUR | ||
| PATNA | ||
| LUCKNOW |
What is the respective ratio of number of readers of India Today in Patna in and that of Frontline in Chandigarh in the same year?
Read the following graph and table carefully and answer the question given below.
Percentage increase in the population of two cities in different years:
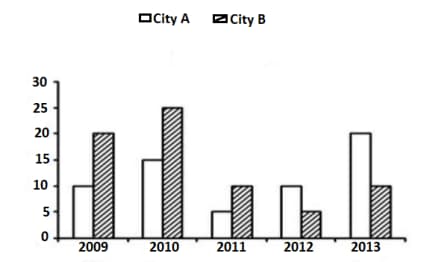
| Population of both city in | |
| City | Population (In Lakh) |
| A | |
| B | |
What will be the population of city B at the end of the ? (In lakh)
Find the next term in the series
Directions: In the given question, a statement has been divided into five segments, each of which is denoted by (A), (B), (C), (D) and (E). Rearrange all the segments to form a coherent statement.
A) of this country for two centuries
B) given Mumbai’s importance
C) it is surprising that
D) in the material and mental landscape
E) it has not claimed the attention of historians
Directions: In the given question, a statement has been divided into five segments, each of which is denoted by (A), (B), (C), (D) and (E). Rearrange all the segments to form a coherent statement.
A) in the Kalahandi region
B) disaster like drought is
C) ecological degradation leading to
D) becoming more frequent leading to ultimate collapse
E) of the traditional livelihood sources
Directions: In the given question, a statement has been divided into five segments, each of which is denoted by (A), (B), (C), (D) and (E). Rearrange all the segments to form a coherent statement.
A) of the market economy network,
B) is very much a part
C) the medical profession in the country
D) its gaping income disparities
E) and its private-profit motivations
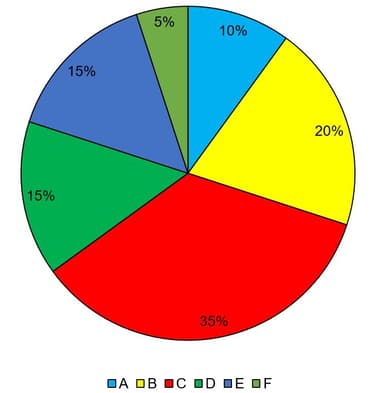
Study the information and answer the question given below:
The below pie chart shows the percentage distribution of the runs scored by all batsmen in the first match.

The total runs scored by all batsmen in the first match
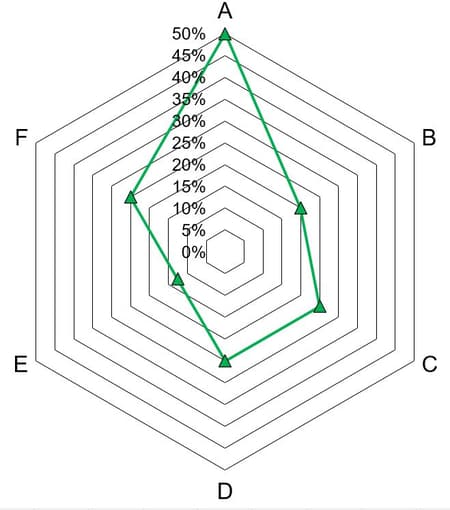
The below web chart shows the percentage distribution of the runs scored by batsmen in the second match (with the respect to the total run scored by each batsman in all three matches).

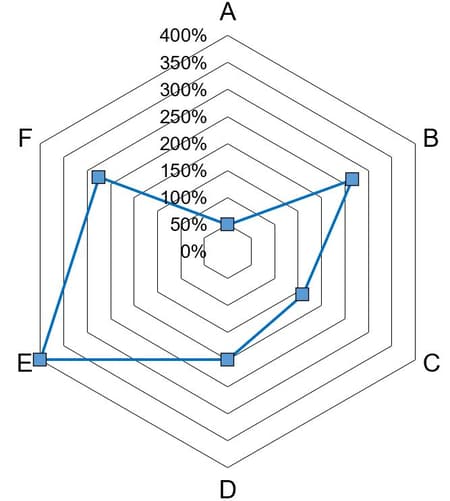
The below web chart shows the percentage of runs scored by each batsman in third match with respect to the second match.

In the three questions, three quantities , and are given, What will be the required relation?
Quantity What is average runs scored by , and in the first match?
Quantity What is average runs scored by , and in the second match?
Quantity What is average runs scored by , and in the third match?
Study the information and answer the question given below:
The below pie chart shows the percentage distribution of the runs scored by all batsmen in the first match.
The total runs scored by all batsmen in the first match
The below web chart shows the percentage distribution of the runs scored by batsmen in the second match (with the respect to the total run scored by each batsman in all three matches).

The below web chart shows the percentage of runs scored by each batsman in third match with respect to the second match.

Find the ratio of the average runs scored by and .
Study the information and answer the question given below:
The below pie chart shows the percentage distribution of the runs scored by all batsmen in the first match.

The total runs scored by all batsmen in the first match
The below web chart shows the percentage distribution of the runs scored by batsmen in the second match (with the respect to the total run scored by each batsman in all three matches).
The below web chart shows the percentage of runs scored by each batsman in third match with respect to the second match.
The combined run scored by and in the first match is what per cent to the runs scored by in the third match?
Study the information and answer the question given below:
The below pie chart shows the percentage distribution of the runs scored by all batsmen in the first match.

The total runs scored by all batsmen in the first match
The below web chart shows the percentage distribution of the runs scored by batsmen in the second match (with the respect to the total run scored by each batsman in all three matches).

The below web chart shows the percentage of runs scored by each batsman in third match with respect to the second match.

In the two questions, two quantities and are given, What will be the required relation?
Quantity What is average runs scored by , and in the second match?
Quantity Find the difference between the runs scored by and in the first match.
Which of the following vehicles travelled at the same speed on both the days ?


